Initiating Coverage | Capital goods
April 6, 2018
GMM Pfaudler Limited
BUY
CMP
`712
‘Lining’ up ‘glassy’ growth story
Target Price
`861
GMM Pfaudler Limited (GMM) is the Indian market leader in glass-lined (GL)
Investment Period
12 Months
steel equipment used in corrosive chemical processes of agrochemicals, specialty
chemical and pharma sector. The company is seeing strong order inflow from
the user industries which is likely to provide 20%+ growth outlook for next
Stock Info
couple of years.
Sector
Industrial Machinery
Market leader in niche space: Supported by patented technology of its global
Market Cap (` cr)
1,040
parent- Pfaulder Inc, GMM commands 50%+ market share in `400 cr Indian GL
Beta
0.7
space (~67% of the standalone business). The second player- Swiss Glascoat is
52 Week High / Low
884/504
just 1/5th of GMM’s business. GMM has a strong and sticky clientele comprising
Avg. Daily Volume
5,837
global giants in chemicals and pharma space.
Face Value (`)
2
Robust demand from user industries: In the last 7 years, GMM has seen a CAGR
BSE Sensex
33,597
of 9% in revenue. This is expected to cross 15%+ over the next few years mainly
Nifty
10,325
led by uptick in demand from user industries. Indian agrochemicals and specialty
Reuters Code
GMMP.BO
chemicals players are seeing a buoyant demand due to slowdown in Chinese
Bloomberg Code
GMM.IN
competition. Most of these companies are expanding or upgrading their
manufacturing facilities which will augur well for GMM.
Shareholding Pattern (%)
Non-GL business and exports to boost growth: GMM has increased focus on the
Promoters
75.0
non-GL business, which includes mixing equipment, filtration and drying
MF / Banks / Indian Fls
0.4
equipment for the chemical processing industry. It is expecting to increase its
FII / NRIs / OCBs
0.1
share of non-GL business to 50% by 2020. Pfaudler Inc has been taken over by
Indian Public / Others
24.5
DB AG (a German PE firm) in 2014 which is keen on increasing exports from its
Indian entity to supply to Europe. GMM is targeting to increase exports to 15-
Abs.(%)
3m 1yr
3yr
20% of revenue from 6% in FY2017.
Sensex
(2.1)
10.9
16.7
GMM Pfaudler
(10.3)
35.2
132.9
Outlook & Valuation: GMM is likely to maintain the 20%+ growth trajectory over
FY18-20 backed by capacity expansion and cross selling of non-GL products to
its clients. The stock is currently trading at 16.5x FY2020 EPS, which offers good
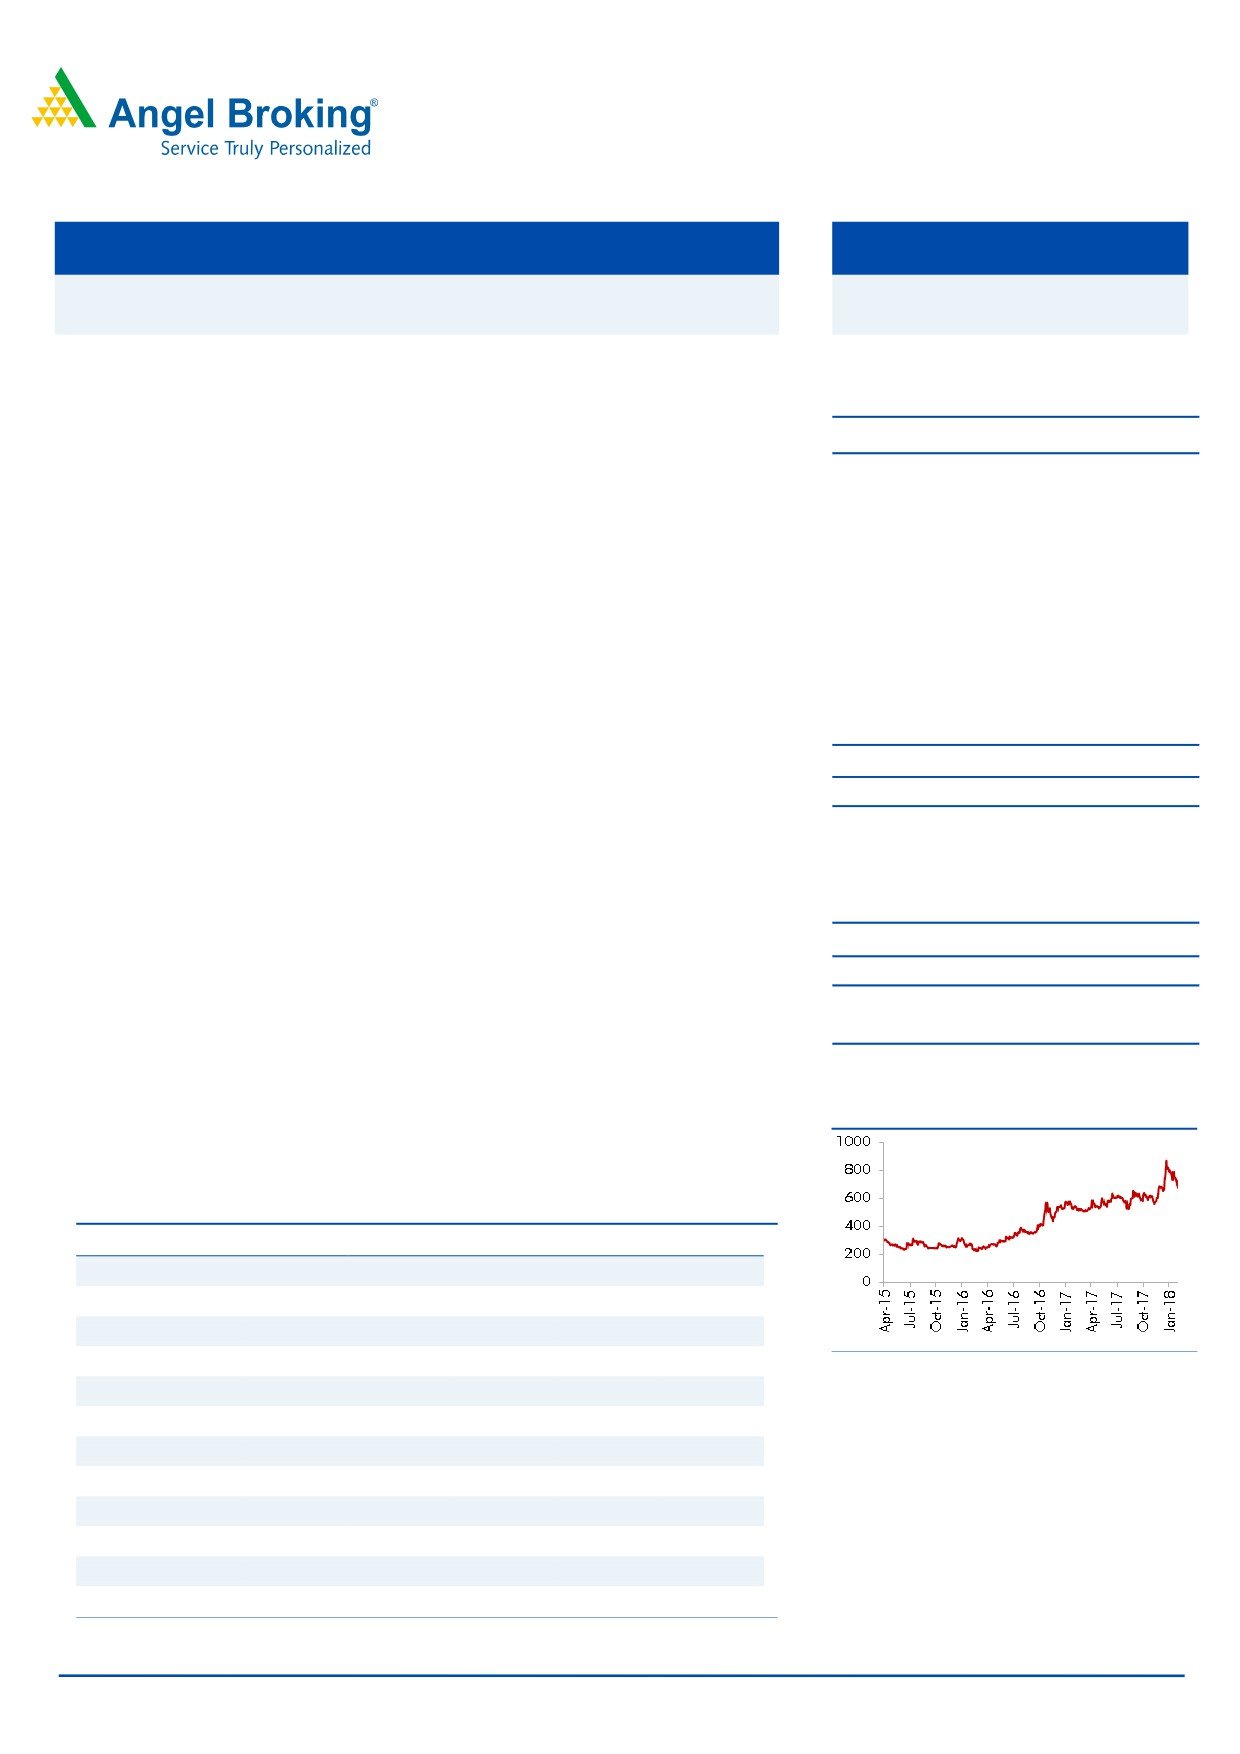
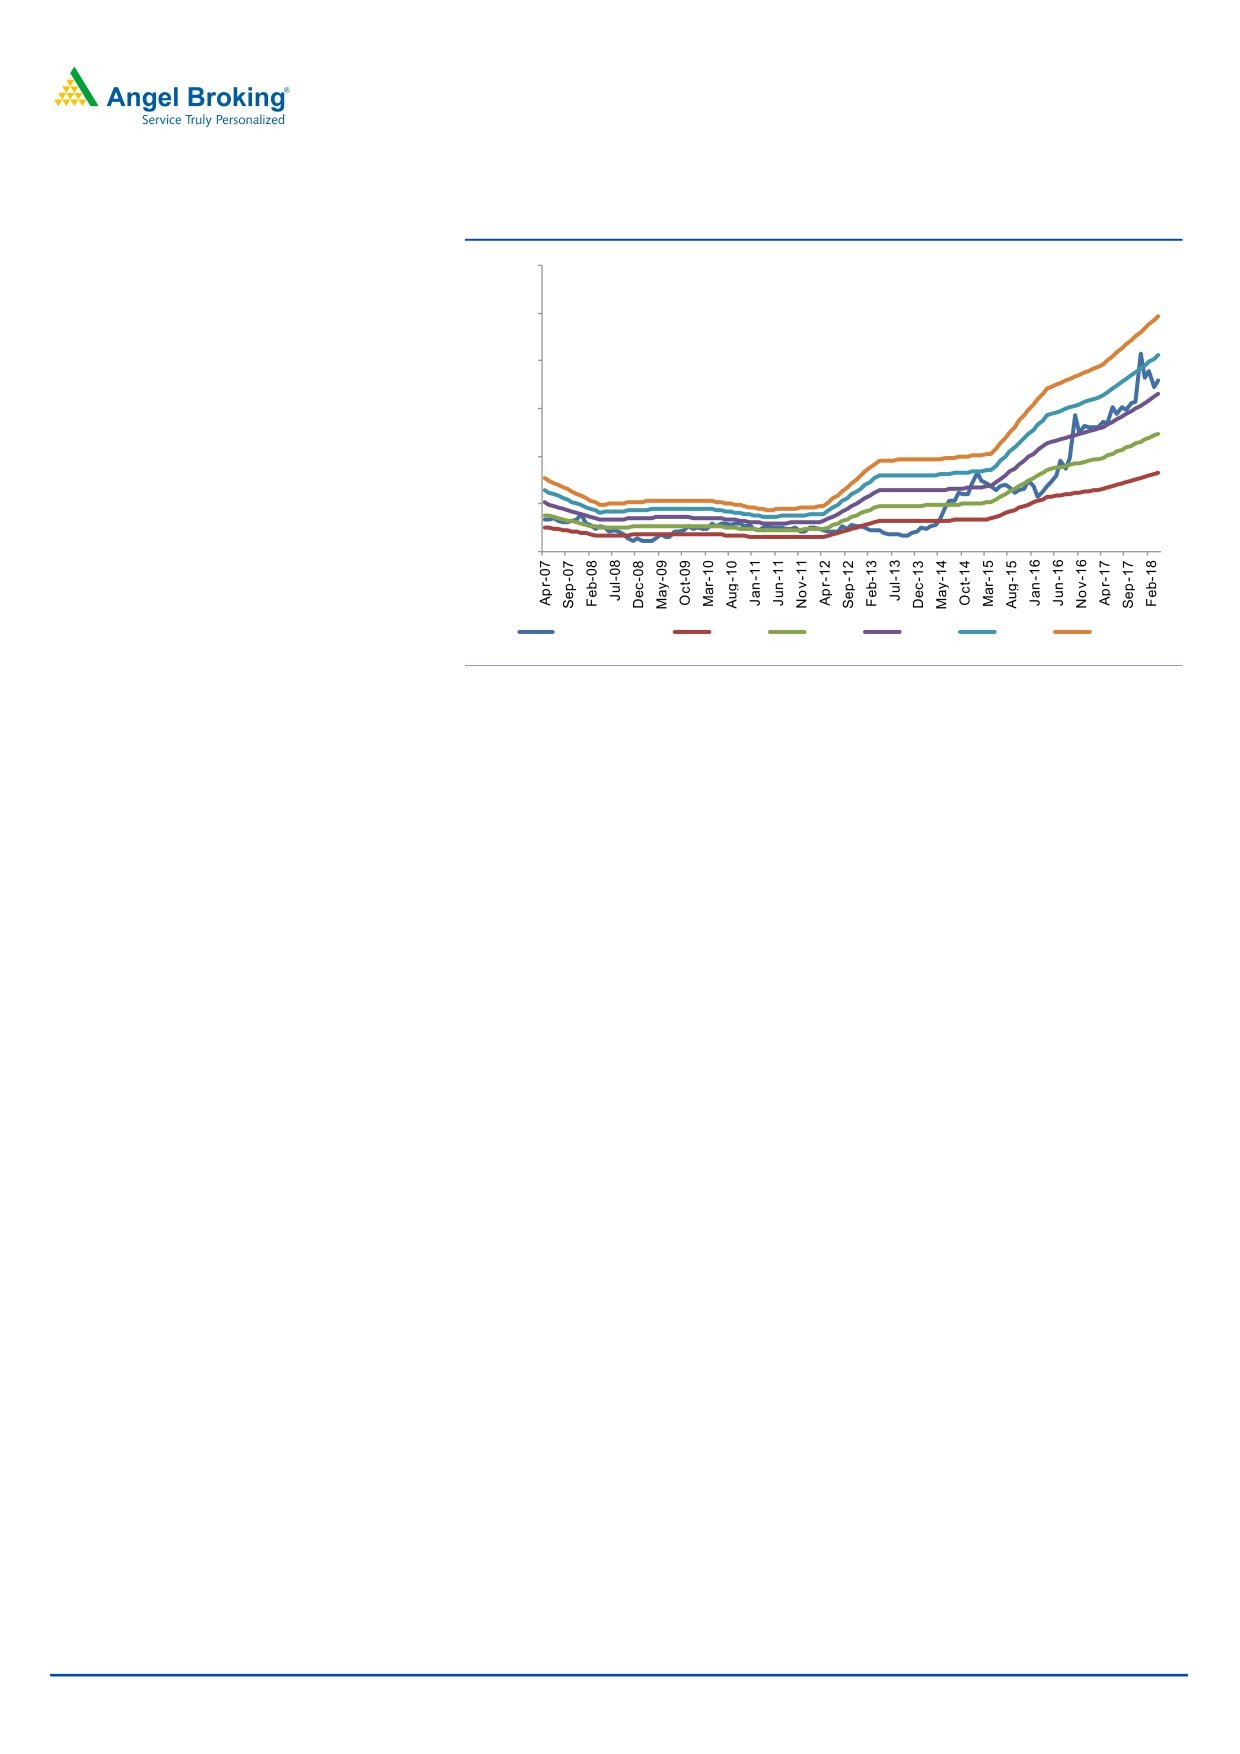
3-year price chart
opportunity to enter the stock. We are initiating coverage on GMM with a Buy
recommendation and Target Price of `861 (20x FY2020E EPS), indicating an
upside of ~21% from the current levels.
Key Financials (Consolidated)
Y/E March (` cr)
FY2016
FY2017
FY2018E FY2019E FY2020E
Net Sales
292.1
353.0
434.8
532.7
649.8
% chg
-5.1
20.9
23.2
22.5
22.0
Net Profit
19.9
33.3
41.3
51.4
62.9
% chg
6.4
67.0
24.3
24.3
22.4
Source: Company, Angel Research
EBITDA (%)
12.0
13.5
13.9
14.1
14.1
EPS (`)
13.6
22.8
28.3
35.2
43.1
P/E (x)
52.2
31.3
25.1
20.2
16.5
Nidhi Agrawal
022-39357800 Ext: 6872
P/BV (x)
6.2
5.3
4.5
3.8
3.2
RoE (%)
11.9
17.1
18.0
18.8
19.3
RoCE (%)
16.1
20.3
22.4
23.5
24.1
EV/EBITDA(x)
27.8
20.2
15.7
12.5
10.0
EV/Sales(x)
3.3
2.7
2.2
1.8
1.4
Source: Company, Angel Research; Note: closing price as of April 05, 2018
Please refer to important disclosures at the end of this report
1
GMM Pfaudler | Initiating Coverage
Company Background
GMM was established in 1962 as Gujarat Machinery Manufacturers and is listed
on the Bombay Stock exchange. In 1987, Pfaudler Inc., USA, the world leader in
Glass Lined equipment subscribed to 40% equity to form a joint venture. Pfaudler
Inc. further increased their stake to 51% in 1999 and the name of the company
was changed to GMM Pfaudler Ltd. It has a state-of-the-art manufacturing facility
spread over 17 acres in Karamsad, Gujarat. Over the years, the company has
diversified its product portfolio to include Heavy Engineering, Mixing Systems,
Engineered Systems and Filtration & Drying Equipment to grow revenue and
reduce the cyclicality of the business.
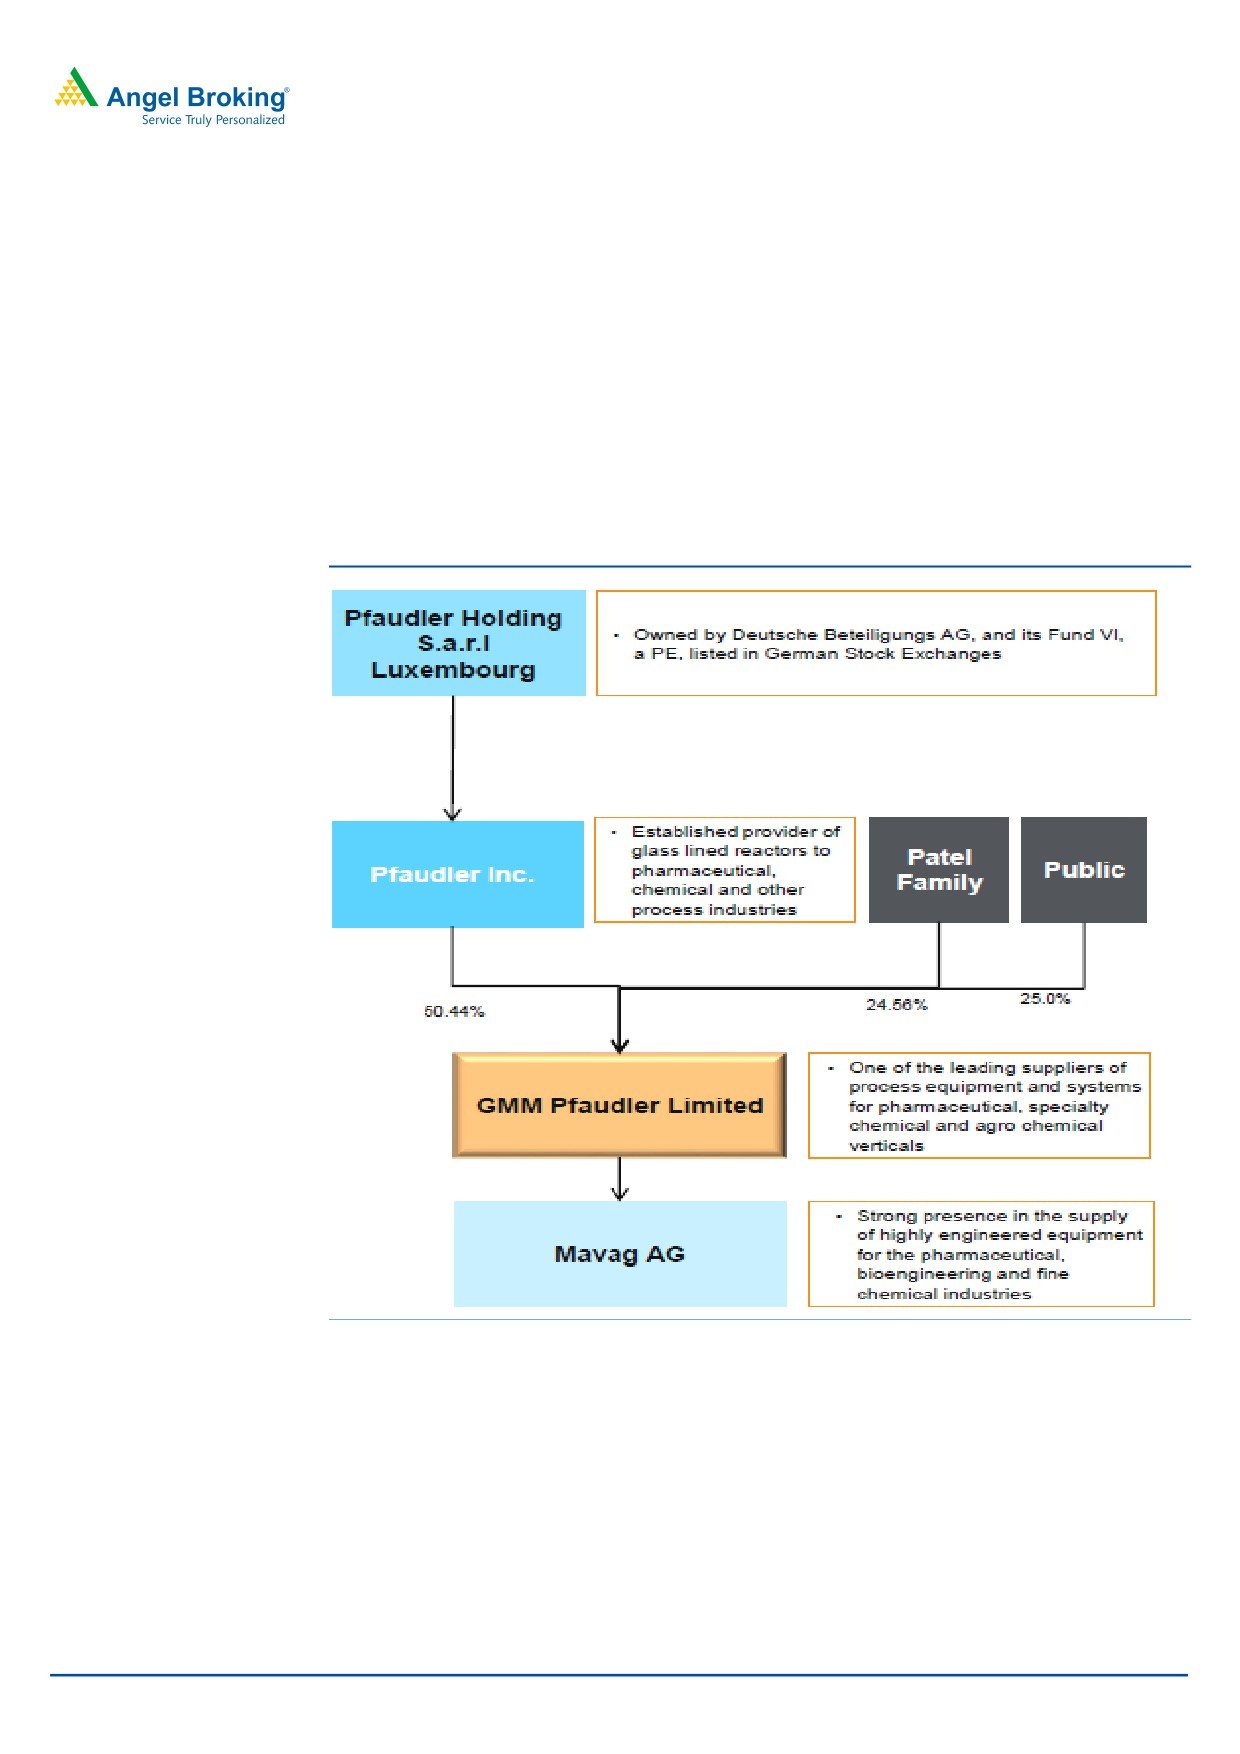
Exhibit 1: Organization overview
Source: Company
Business Segments :
The Company has 3 business segments:
i) Glass Lined Equipment (GL): GMM is the market leader in this segment and
maintained its leadership position in the domestic market during the year. The
production increased from 1196 vessels to 1435 vessels in FY2017. The company
is further increasing production to 2000 vessels in FY2018. The Company
manufactured and supplied the first batch of vessels to Pfaudler, Italy which will be
sold in the European market.
April 06, 2018
2
GMM Pfaudler | Initiating Coverage
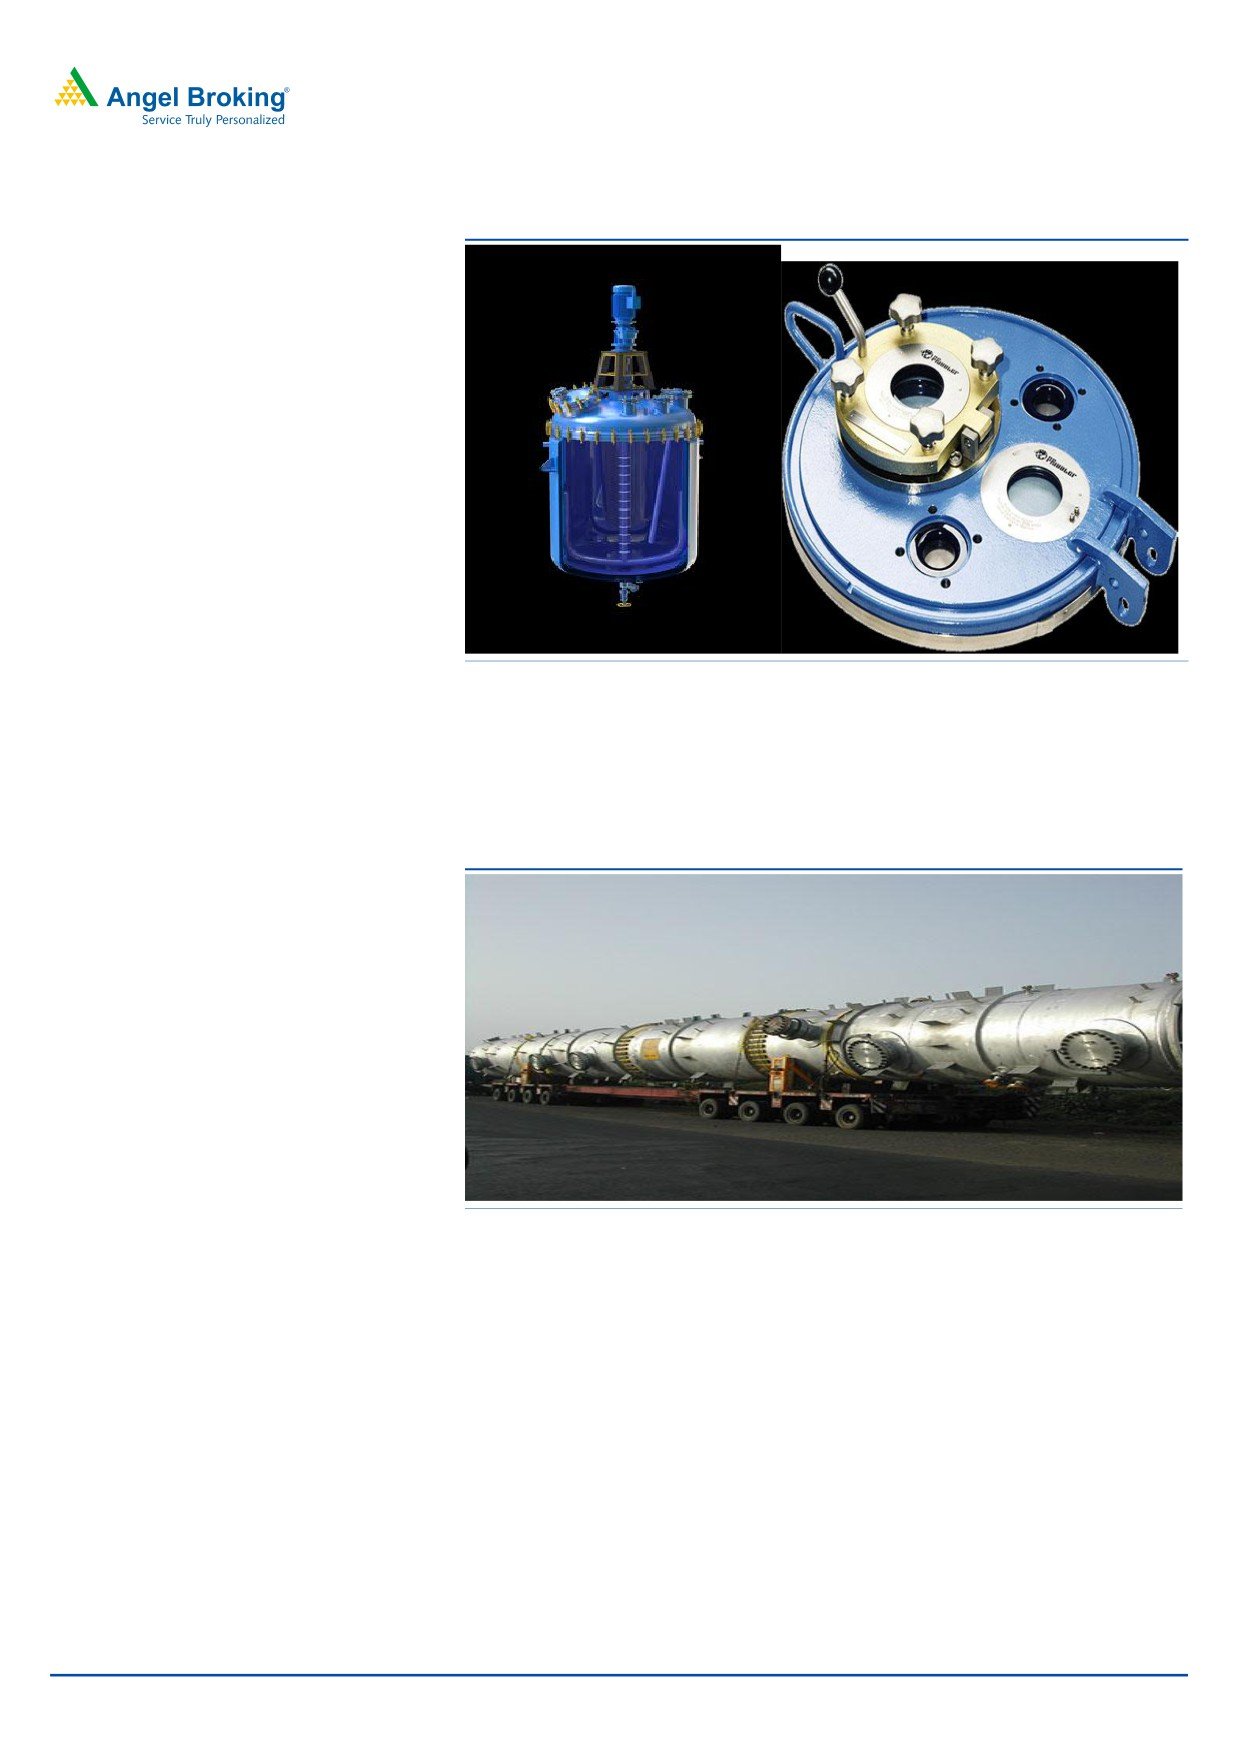
Exhibit 2: Glass Lined Equipments
Source: Company
ii) Heavy Engineering (HE): The HE business has been a focus area for the
company. GMM managed to grow the business by leveraging its brand, strong
engineering capabilities, multiple code accreditations and proven track record of
manufacturing complex equipment.
Exhibit 3: Pressure Vessels
Source: Company
iii) Proprietary Products (PP): This business line includes the following products:
Mixing Systems (MS), Engineered Systems (ES) and Filtration & Drying Equipment
(F&D).
a) Mixing Systems (MS):
Pharmaceutical, Agrochemical and Specialty Chemical Companies in India are
looking at innovative mixing solutions to improve productivity. To exploit these
opportunities, the Company has built engineering capabilities and cost effective &
user friendly equipment. It is also targeting new industry segments like Paints,
Resins, Inks, Biotech, Food Processing, Petrochemicals and Pulp & Paper to grow
this business.
April 06, 2018
3
GMM Pfaudler | Initiating Coverage
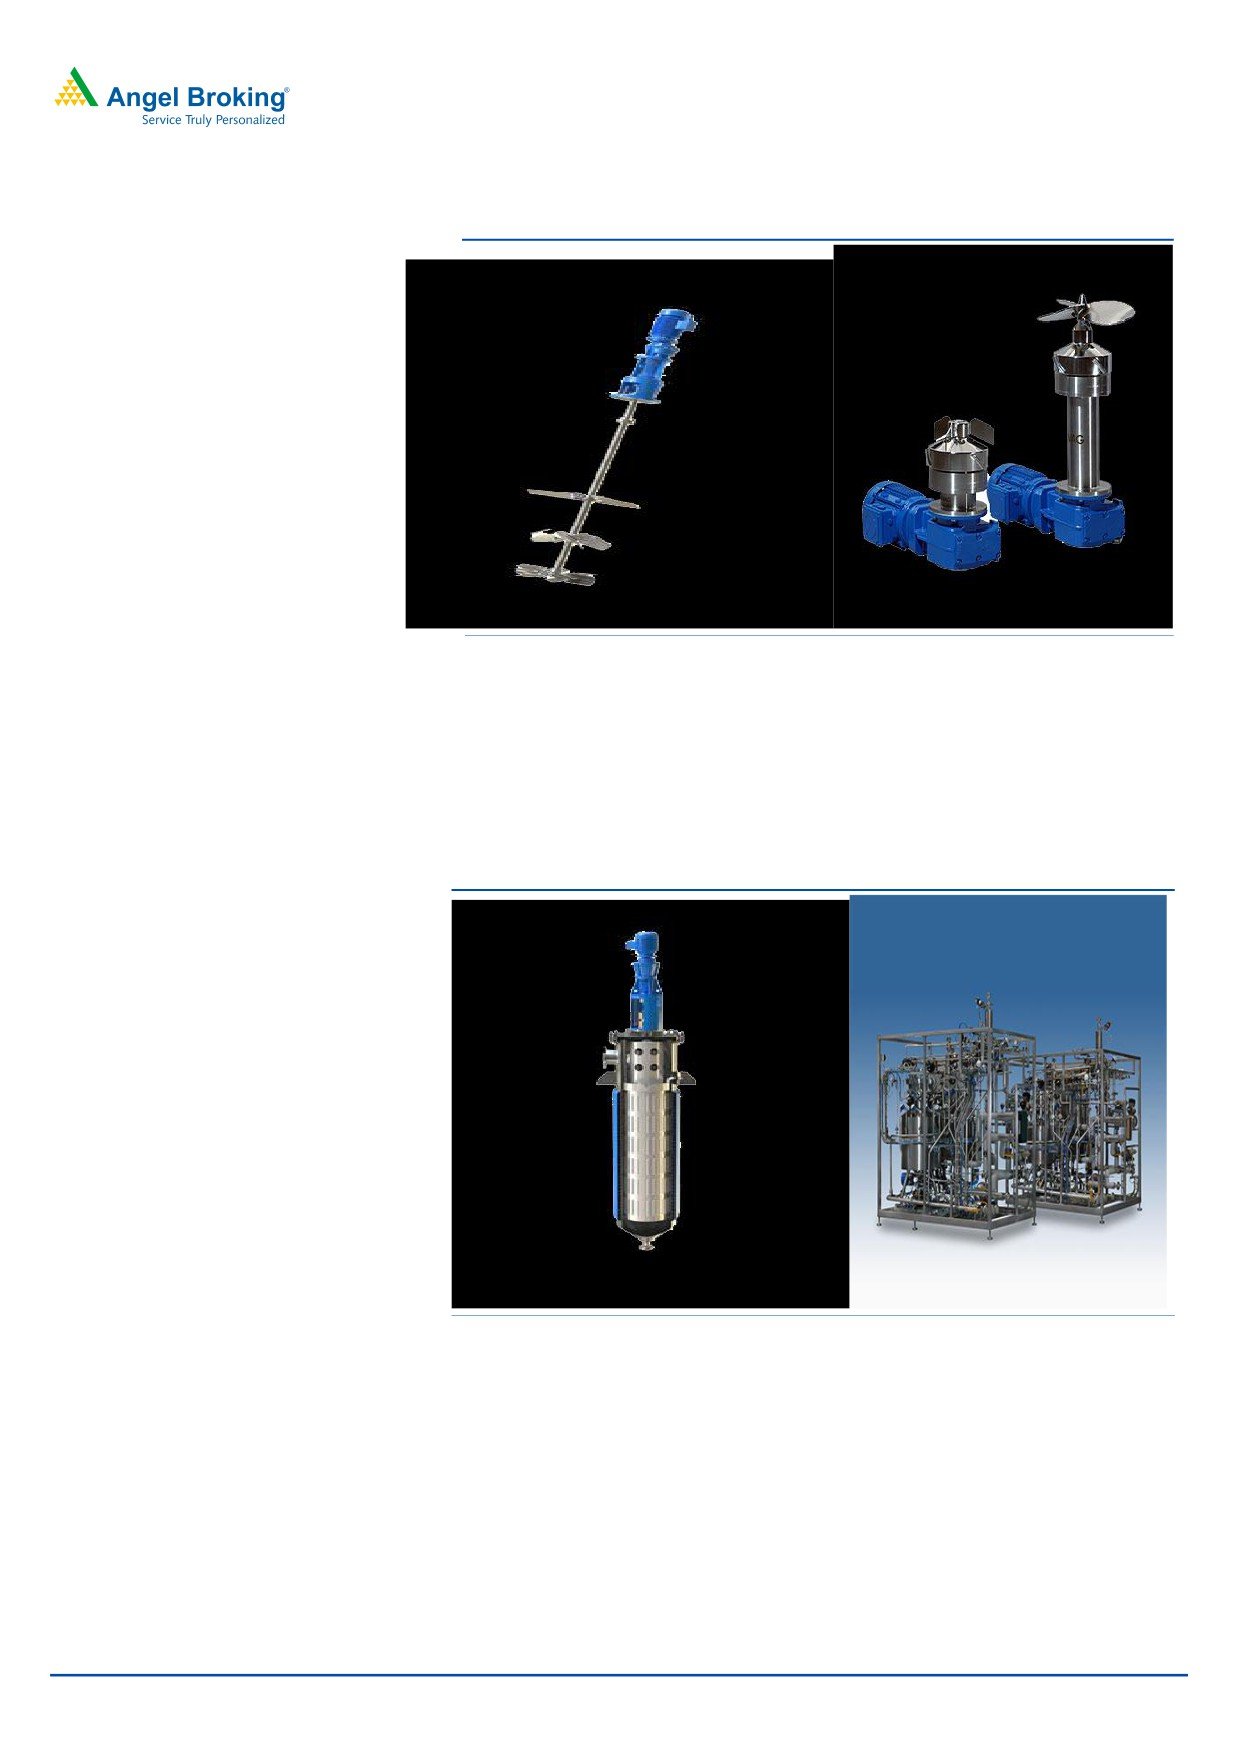
Exhibit 4: Mixing Systems
Source: Company
b) Engineered Systems (ES):
The company has extensive experience in designing and manufacturing complete
Modular Skids. As the company moves from being an equipment supplier to a
solution provider, it is developing process engineering capabilities so as to provide
process guarantees to its customers.
Exhibit 5: Wiped Film Evaporators and Temperature Control Units
Source: Company
c) Filtration & Drying Equipment (F&D):
The company targets critical applications, such as high potency and sterile
applications. This business line has seen significant growth over the last few years
and will continue to target critical applications in the domestic and export markets
to grow this business even further. F&D division also provides low cost components
to its subsidiary Mavag AG.
April 06, 2018
4
GMM Pfaudler | Initiating Coverage
Exhibit 6: Filters and Spherical Dryer
Source: Company
Exhibit 7: Segments at a glance
%
Segments
Description
User Industries
Peers
revenue
Swiss Glasscoat, De
Specialty Chemicals,
Dietrich, Sachin
Glass Lined
Glass-lined (GL) steel equipment used in corrosive chemical
67%
Agro Chemicals,
Industries, Standard
Equipment
processes
Pharma
Glass Lining
Technoloy
Refineries, Oil & Gas,
Mining & Minerals,
Anup Engineering,
Heavy
Customised process equipment like heat exchangers, pressure
16%
Fertilizers, Chemical
Patel Airtemps,HLE
Engineering
vessels
Processing and
Engineers etc
Pharmaceutical.
Chemicals, Pharma,
Proprietary
Ancillaries products to GL like Mixing Systems (MS), Engineered
Swiss Glasscoat, De
17%
Food, Paper,
Products
Systems (ES) and Filtration & Drying Equipment (F&D).
Dietrich etc
Paints,etc
Source: Company, Angel Research
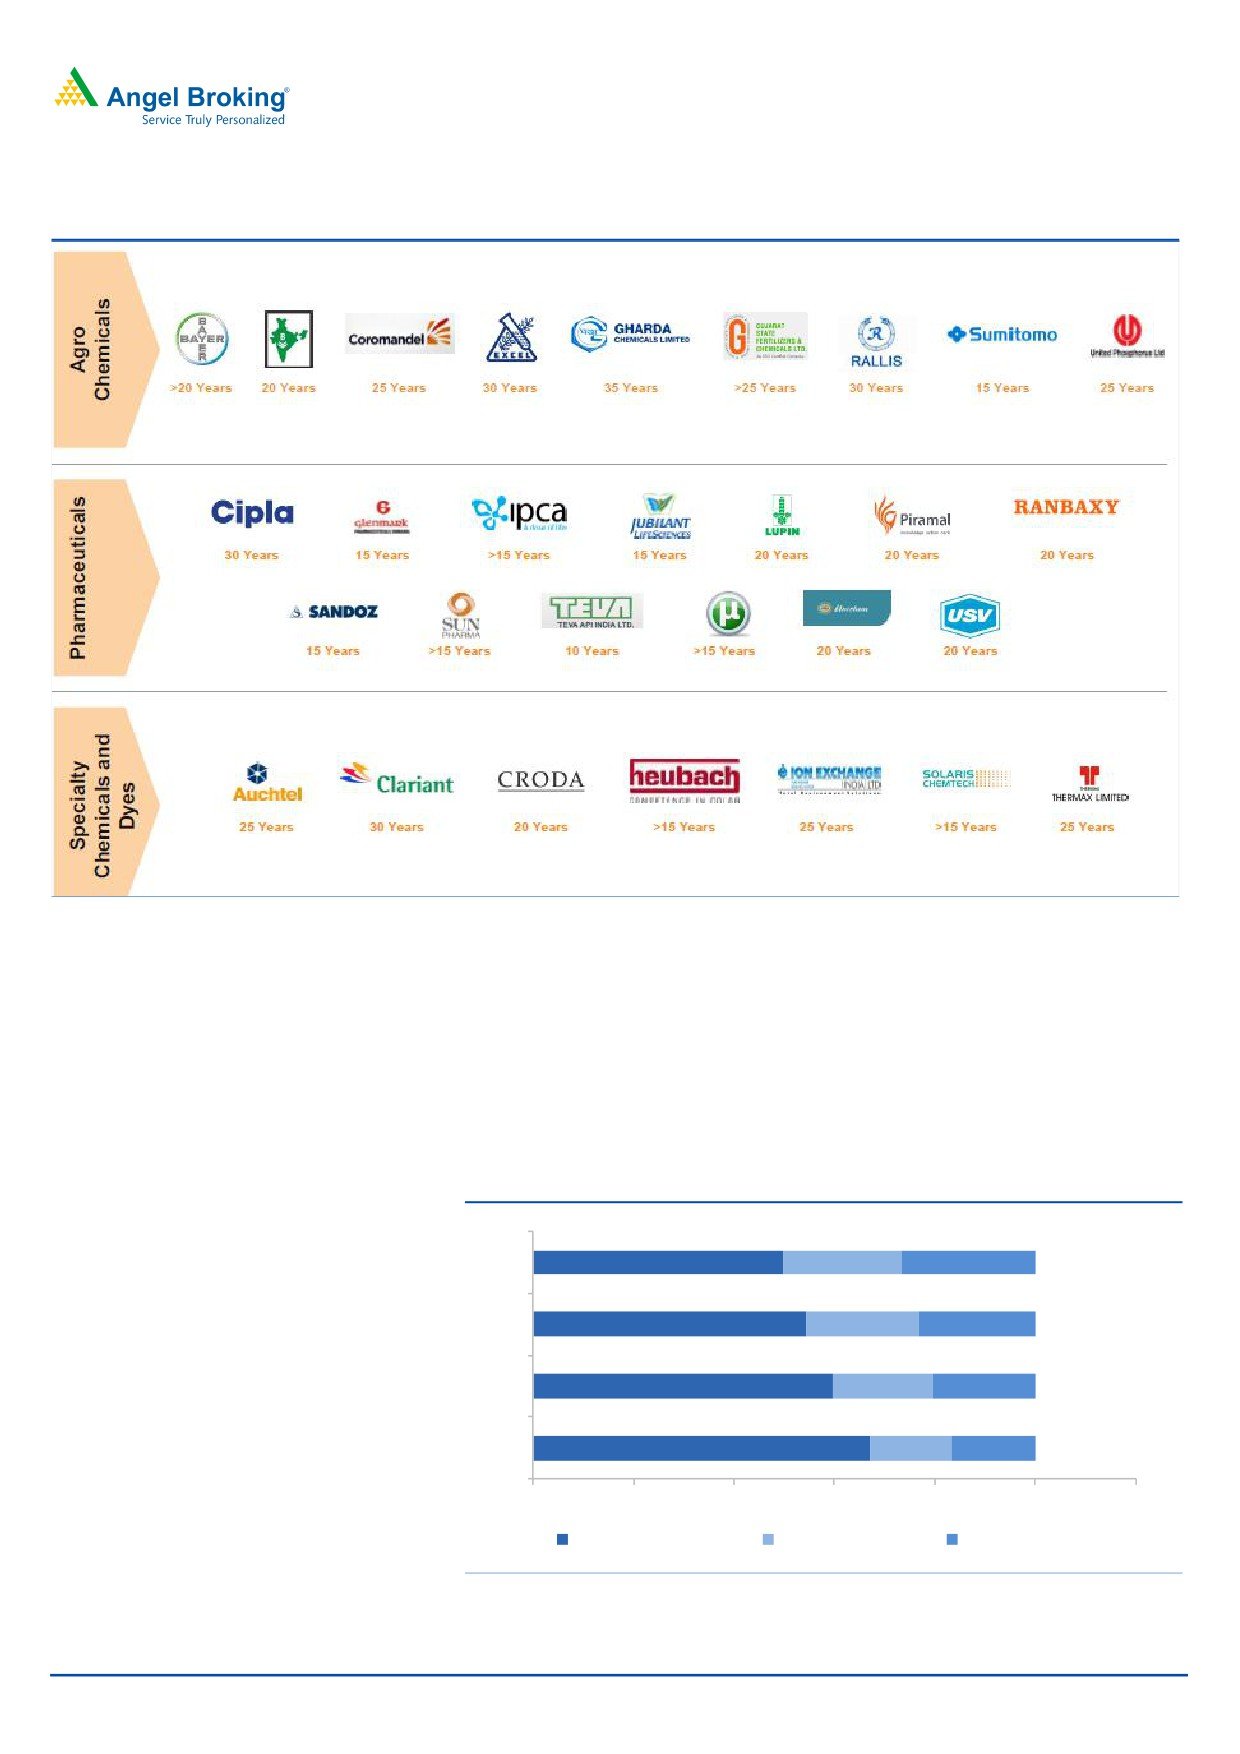
Strong and Sticky Clientele base…
GMM has a strong and sticky clientele comprising global giants in agrochemical,
chemical and pharma space for its GL business. Over the years, the pharma
sector’s share has come down from 60% to 40% whereas agrochemical and
specialty chemical now forms over 50% of the business. GL forms 8-10% of capex
undertaken by pharma sector, hence any uptick in pharma capex with setting up of
Phrama city in Hyderabad would be positive for company. With 50% market share
and sticky clientele, while GL business is to grow by sombre10-12% CAGR for next
few years. This growth is similar to GL business growth rate of 10% over FY2014-
17.
April 06, 2018
5
GMM Pfaudler | Initiating Coverage
Exhibit 8: Strong and Stable Customer Base
Source: Company, Angel Research
Non GL segments to drive growth
The company is using its track record and strong client relationship to cross sell its
ancillaries products to its clients. It is expecting to increase share of non-GL
business from the current 33% to 50% by 2020. The major growth is likely to come
from its non GL business which is likely to grow 35-40%. Global parent has been
taken over by DB AG (german PE firm) which is keen on increasing exports from
this Indian entity to supply especially to Europe. It is targeting to increase exports to
15-20% of revenue from 6% reported in FY2017.
Exhibit 9: Share of non-GL business to go up
FY20
FY19
FY18
FY17
0%
20%
40%
60%
80%
100%
120%
Glass lined equipment
Heavy engineering
Proprietry products
Source: Company, Angel Research
April 06, 2018
6
GMM Pfaudler | Initiating Coverage
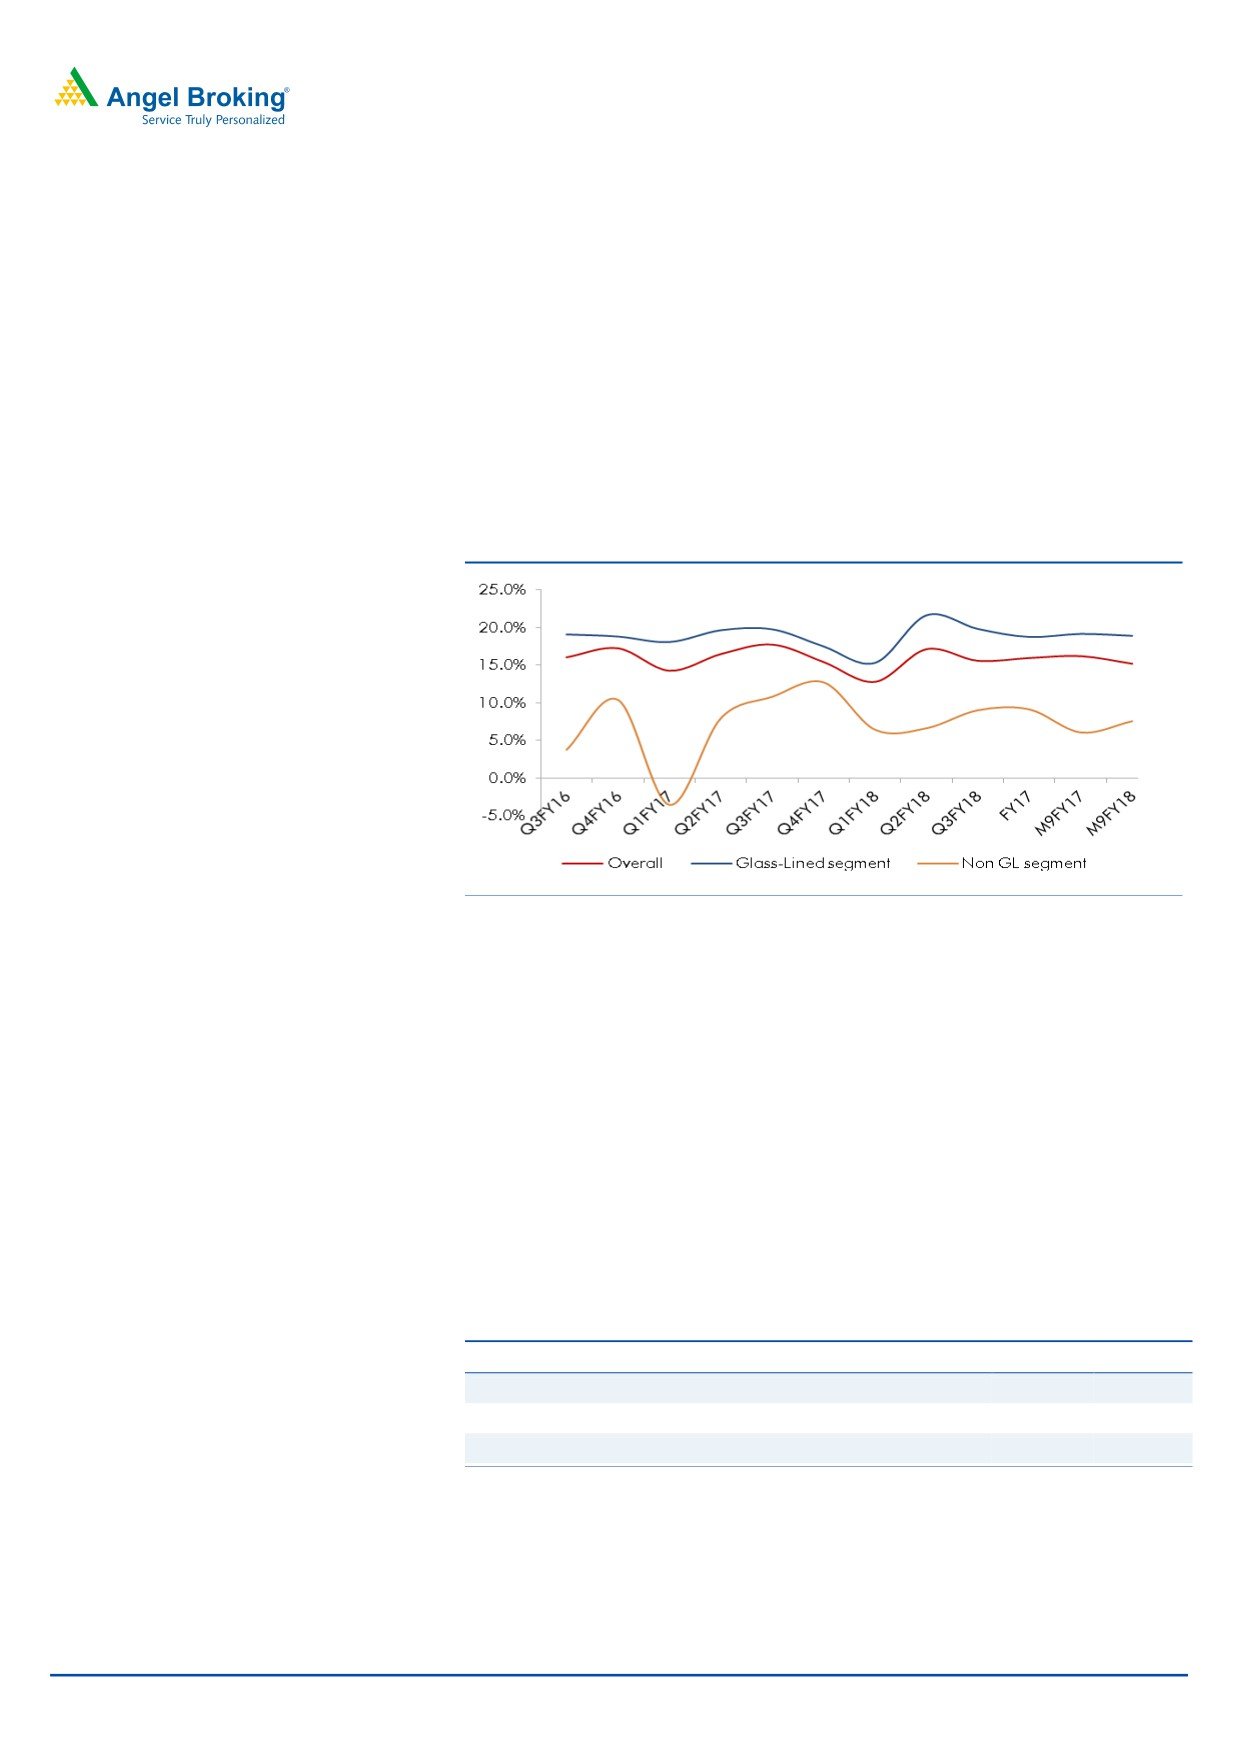
Margins to remain healthy
Margins in non-GL segments have seen a 150 bps improvement in M9FY2018 led
by operating leverage owing to 70% yoy growth in revenue. This is likely to
continue as agrochemical and specialty chemical industry continues to invest in
their manufacturing capacities which would boost GMM’s business in all
categories. Raw material forms 50% of the GL segment’s revenue and other
variable overheads forms 20%. It uses mainly carbon steel from players like SAIL
for which it maintains a quarterly inventory for steel and largely passes through RM
price variations for large contracts. Overall, margins are likely to sustain 13-14%
level.
Exhibit 10: Segment-wise margins
Source: Company, Angel Research
Its subsidiary - MAVAG is also expected to do well
In 2008, GMM acquired Mavag AG, Switzerland. Mavag supplies non GL/ highly
engineered equipment for critical filtration, drying and mixing applications to the
pharmaceutical and biotech industries. In the past, its profitability has been very
volatile due to high cost of production and slowdown in Europe. However, with
increased outsourcing from India and cost control measures being taken in this
company in the recent times, MAVAG is seeing uptick in margins as the business
traction improves. Operating leverage starts kicking in this business once its
business crosses 10 mn CHF (~`67 cr) in revenue which will drive margin
expansion in this entity in future.
Exhibit 11: MAVAG's Financial
` cr
FY15
FY16
FY17
Sales
84
70
88
PAT
2
1
6
PAT margin %
1.9%
1.4%
6.9%
Source: Company, Angel Research
Strong balance sheet and healthy return ratios
Its efficient working capital cycle of 40-45 days keeps on generating annual
operating cash flow in excess of `20 cr, which largely funds its annual
maintenance capex requirements of Rs 15 cr. GMM has recently expanded its
April 06, 2018
7
GMM Pfaudler | Initiating Coverage
capacity from
1400 unit to
2000 units through debottlenecking and
installation of a new gas furnace with a capex of `7 cr. This new furnace is
likely to save power cost for company. It is also looking at outsourcing some of
non core activities. The company is debt free and enjoys healthy return ratios.
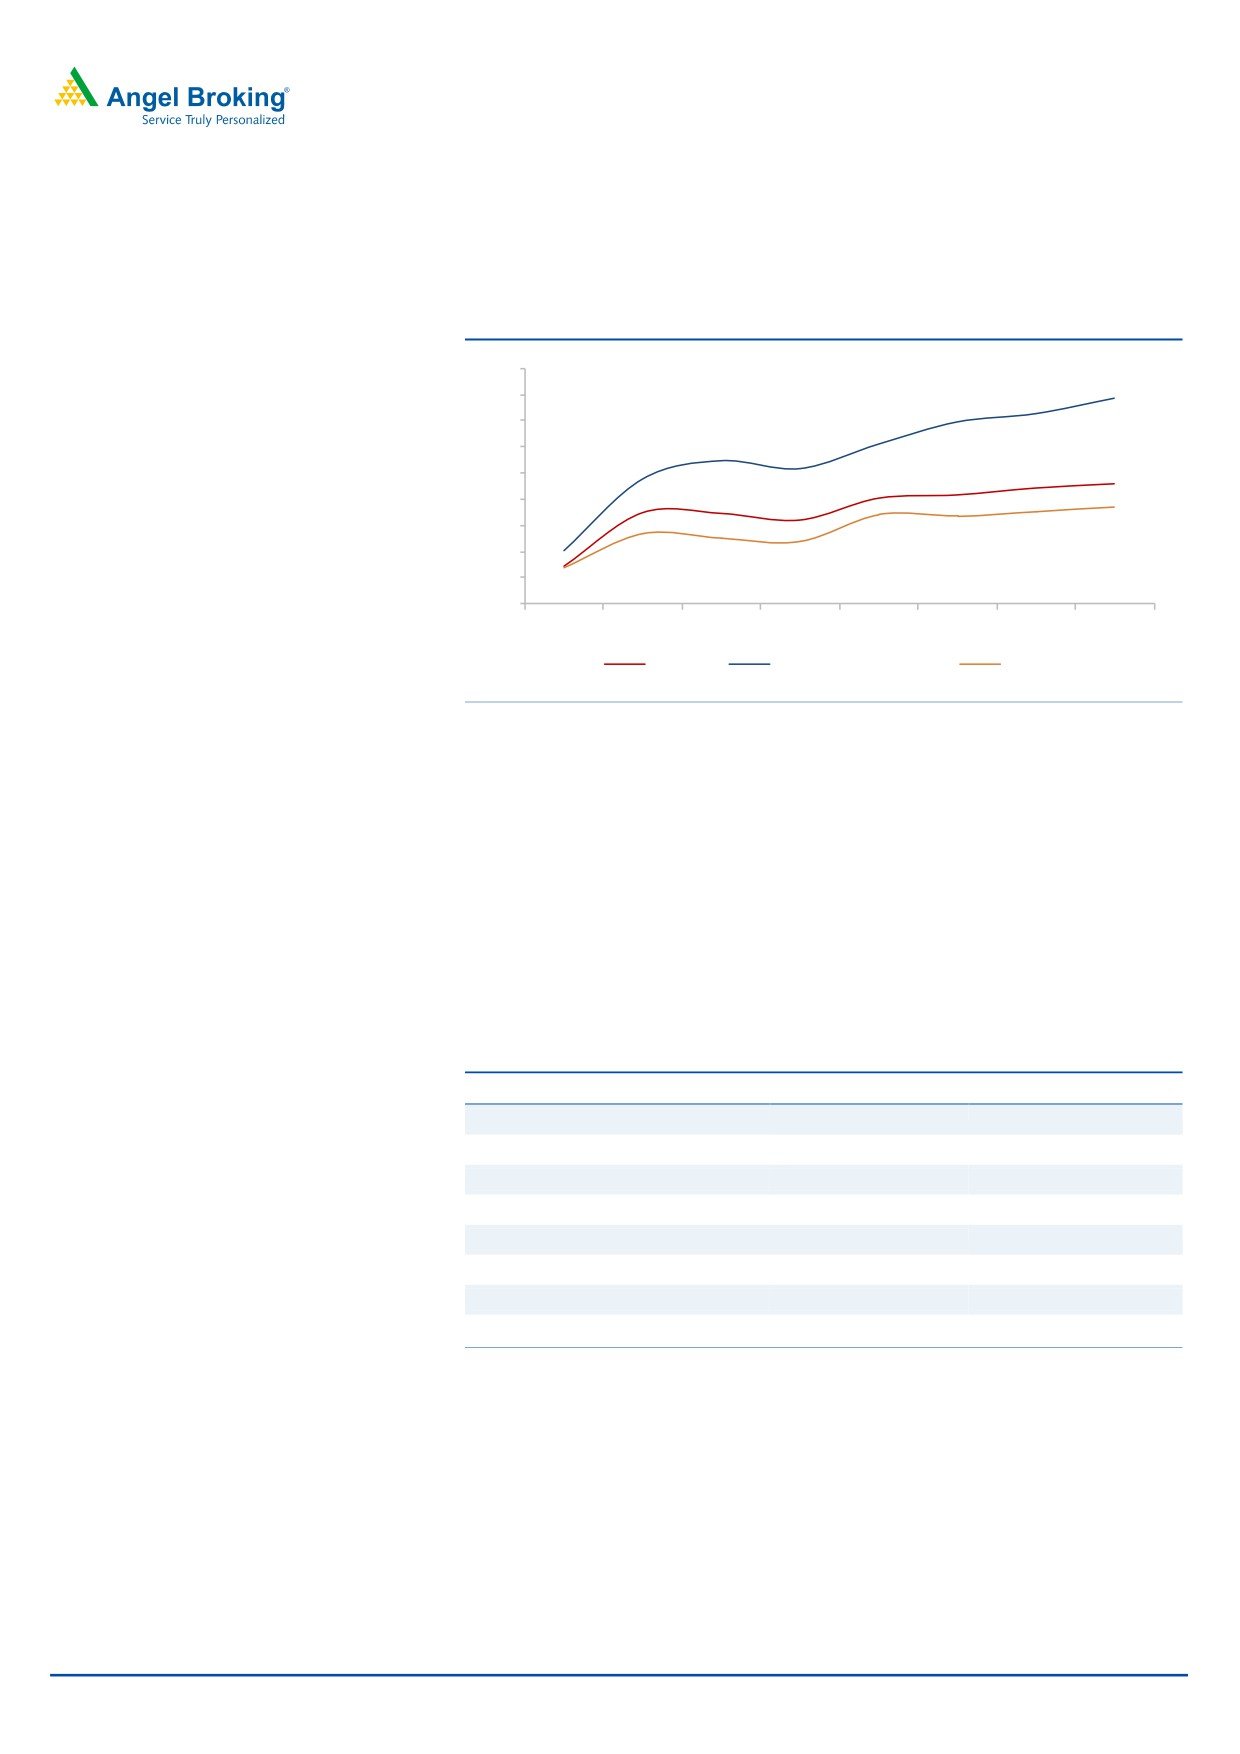
Exhibit 12: Return ratios are improving
45
40
35
30
25
20
15
10
5
-
FY13
FY14
FY15
FY16
FY17
FY18E FY19E FY20E
ROCE
Angel ROIC (Pre-tax)
ROE
Source: Company, Angel Research
Outlook & Valuation
GMM is likely to maintain the 20%+ growth trajectory over FY18-20 backed by
capacity expansion and demand from user industries. Its nearest competitor- Swiss
Glascoat has been losing market share over the last few years while GMM has
been growing well over the same period. The stock is currently trading at 16.5x
FY2020 EPS, which offers good opportunity to enter the stock. We initiate coverage
on GMM with a ‘Buy’ recommendation and target price of `861 (20x FY2020E
EPS), indicating an upside of ~21% from the current levels.
Exhibit 13: Peer Comparison
Company Name (` cr)
GMM Pfaudler
Swiss Glascoat
FY2017
Sales
353.0
81.5
PAT
33.3
3.1
YoY growth %
67.0
-26.0
CAGR Growth % (FY2014-17)
Revenue
8.0
2.0
EBITDA
13.5
-2.0
PAT
17.0
-7.0
Source: capital line
April 06, 2018
8
GMM Pfaudler | Initiating Coverage
Exhibit 14: One Year Forward P/E
1200.00
1000.00
800.00
600.00
400.00
200.00
0.00
Close -Unit Curr
10.0 X
15.0 X
20.0 X
25.0 X
30.0 X
Source: Company, Angel Research
Risks to our estimates
GMM’s primary raw material is steel; any abrupt fluctuation in pricing will
adversely impact its profitability.
Business may get impacted owing to the inability to get break through with
new clients or slowdown in capex by its clients.
GMM has market exposure to foreign exchange rates mainly on account of
exports, imports and investments in foreign subsidiary, and therefore, it is
subjected to the exchange fluctuation risk.
April 06, 2018
9
GMM Pfaudler | Initiating Coverage
Profit & Loss Statement (consolidated)
Y/E March (` cr)
FY2016
FY2017 FY2018E FY2019E FY2020E
Total operating income
292.1
353.0
434.8
532.7
649.8
% chg
-5.1
20.9
23.2
22.5
22.0
Total Expenditure
257.1
305.3
374.2
457.7
558.3
COGS
173.4
209.6
258.1
316.3
385.8
Selling and Administration Expenses
19.2
22.1
25.4
31.1
37.9
Personnel
56.2
66.1
81.4
99.7
121.6
Others Expenses
8.4
7.6
9.3
10.7
13.0
EBITDA
34.9
47.7
60.6
75.0
91.4
% chg
-2.8
36.6
26.9
23.7
22.0
(% of Net Sales)
12.0
13.5
13.9
14.1
14.1
Depreciation& Amortisation
8.1
8.2
9.2
10.8
12.7
EBIT
26.8
39.5
51.4
64.2
78.7
% chg
2.7
47.3
30.1
24.9
22.7
(% of Net Sales)
9.2
11.2
11.8
12.0
12.1
Interest & other Charges
0.7
0.9
0.5
0.5
0.5
Other Income
3.6
8.3
9.9
11.9
14.3
(% of Sales)
1.2
2.3
2.3
2.2
2.2
Extraordinary Items
-
-
-
-
-
Share in profit of Associates
-
-
-
-
-
Recurring PBT
29.8
46.9
60.8
75.5
92.5
% chg
5.6
57.4
29.8
24.3
22.4
Tax
9.7
13.6
19.5
24.2
29.6
PAT (reported)
19.9
33.3
41.3
51.4
62.9
% chg
6.4
67.0
24.3
24.3
22.4
(% of Net Sales)
6.8
9.4
9.5
9.6
9.7
Basic & Fully Diluted EPS (Rs)
13.6
22.8
28.3
35.2
43.1
% chg
6.4
67.0
24.3
24.3
22.4
Source: Company, Angel Research
April 06, 2018
10
GMM Pfaudler | Initiating Coverage
Balance Sheet (consolidated)
Y/E March (` cr)
FY2016
FY2017
FY2018E FY2019E FY2020E
Sources of funds
Equity Share Capital
2.9
2.9
2.9
2.9
2.9
Reserves& Surplus
163.9
191.9
226.8
270.1
323.2
Shareholders’ Funds
166.8
194.8
229.7
273.0
326.1
Minority Interest
-
-
-
-
-
Total Loans
-
-
-
-
-
Other Liab & Prov
4.4
11.1
11.6
12.1
12.8
Total Liabilities
171.3
205.9
241.3
285.2
338.9
Application Of Funds
Net Block
53.4
61.2
67.0
71.2
73.5
Capital Work-in-Progress
4.3
2.0
2.0
2.0
2.0
Investments
13.7
44.6
64.6
84.6
94.6
Current Assets
178.6
207.9
240.3
282.5
358.1
Inventories
70.9
82.3
101.3
124.1
151.4
Sundry Debtors
48.7
69.9
86.1
105.5
128.7
Cash
53.6
31.7
23.2
16.6
33.6
Loans & Advances
5.5
24.1
29.7
36.4
44.4
Other Assets
-
-
-
-
-
Current liabilities
84.4
113.2
137.0
160.5
195.8
Net Current Assets
94.2
94.7
103.3
122.0
162.2
Other Non Current Asset
5.6
3.4
4.3
5.3
6.5
Total Assets
171.3
205.9
241.3
285.2
338.9
Source: Company, Angel Research
April 06, 2018
11
GMM Pfaudler | Initiating Coverage
Cash Flow Statement (consolidated)
Y/E March (`cr)
FY2016
FY2017
FY2018E FY2019E FY2020E
Profit before tax
29.8
46.9
60.8
75.5
92.5
Depreciation
8.1
8.2
9.2
10.8
12.7
Change in Working Capital
(2.0)
(12.8)
(15.0)
(25.4)
(23.2)
Interest / Dividend (Net)
-
-
-
-
-
Direct taxes paid
(9.6)
(14.0)
(19.5)
(24.2)
(29.6)
Others
1.8
5.3
-
-
-
Cash Flow from Operations
24.7
23.0
35.5
36.8
52.4
(Inc.)/ Dec. in Fixed Assets
(13.9)
(14.4)
(15.0)
(15.0)
(15.0)
(Inc.)/ Dec. in Investments
0.3
0.1
-
-
-
Cash Flow from Investing
(17.0)
(22.0)
(36.9)
(35.4)
(25.5)
Issue of Equity
-
-
-
-
-
Inc./(Dec.) in loans
-
-
-
-
-
Others
6.0
6.3
6.5
8.0
9.8
Cash Flow from Financing
(6.0)
(6.3)
(6.5)
(8.0)
(9.8)
Inc./(Dec.) in Cash
1.7
(5.3)
(7.9)
(6.7)
17.1
Opening Cash balances
34.7
36.4
31.1
23.2
16.6
Closing Cash balances
36.4
31.1
23.2
16.6
33.6
Free cash Flow
10.8
8.6
20.5
21.8
37.4
Source: Company, Angel Research
April 06, 2018
12
GMM Pfaudler | Initiating Coverage
Key Ratios (consolidated)
Y/E March
FY2016
FY2017
FY2018E
FY2019E
FY2020E
Valuation Ratio (x)
P/E (on FDEPS)
52.2
31.3
25.1
20.2
16.5
P/CEPS
27.9
18.3
14.9
12.1
9.9
P/BV
6.2
5.3
4.5
3.8
3.2
Dividend yield (%)
0.4
0.6
0.6
0.6
0.8
EV/Sales
3.3
2.7
2.2
1.8
1.4
EV/EBITDA
27.8
20.2
15.7
12.5
10.0
EV / Total Assets
5.7
4.7
3.9
3.3
2.7
Per Share Data (Rs)
EPS (Basic)
13.6
22.8
28.3
35.2
43.1
EPS (fully diluted)
13.6
22.8
28.3
35.2
43.1
Cash EPS
25.5
38.9
47.6
58.8
71.6
DPS
3.0
4.0
4.0
4.6
5.6
Book Value
114.3
133.4
157.3
187.0
223.3
Returns (%)
ROCE
16.1
20.3
22.4
23.5
24.1
Angel ROIC (Pre-tax)
25.8
30.5
33.5
34.9
37.4
ROE
11.9
17.1
18.0
18.8
19.3
Turnover ratios (x)
Asset Turnover (Gross Block)
2.6
3.1
3.5
3.8
4.2
Inventory / Sales (days)
89
85
85
85
85
Receivables (days)
61
72
72
72
72
Payables (days)
101
115
115
110
110
WC cycle (ex-cash) (days)
48
42
42
47
47
Source: Company, Angel Research
Note - Valuation done on closing price of 05/04/2018
April 06, 2018
13
GMM Pfaudler | Initiating Coverage
Research Team Tel: 022 - 39357800
DISCLAIMER
Angel Broking Private Limited (hereinafter referred to as “Angel”) is a registered Member of National Stock Exchange of India Limited,
Bombay Stock Exchange Limited and Metropolitan Stock Exchange Limited. It is also registered as a Depository Participant with CDSL
and Portfolio Manager with SEBI. It also has registration with AMFI as a Mutual Fund Distributor. Angel Broking Private Limited is a
registered entity with SEBI for Research Analyst in terms of SEBI (Research Analyst) Regulations, 2014 vide registration number
INH000000164. Angel or its associates has not been debarred/ suspended by SEBI or any other regulatory authority for accessing
/dealing in securities Market. Angel or its associates/analyst has not received any compensation / managed or co-managed public
offering of securities of the company covered by Analyst during the past twelve months.
This document is solely for the personal information of the recipient, and must not be singularly used as the basis of any investment
decision. Nothing in this document should be construed as investment or financial advice. Each recipient of this document should
make such investigations as they deem necessary to arrive at an independent evaluation of an investment in the securities of the
companies referred to in this document (including the merits and risks involved), and should consult their own advisors to determine
the merits and risks of such an investment.
Reports based on technical and derivative analysis center on studying charts of a stock's price movement, outstanding positions and
trading volume, as opposed to focusing on a company's fundamentals and, as such, may not match with a report on a company's
fundamentals. Investors are advised to refer the Fundamental and Technical Research Reports available on our website to evaluate the
contrary view, if any.
The information in this document has been printed on the basis of publicly available information, internal data and other reliable
sources believed to be true, but we do not represent that it is accurate or complete and it should not be relied on as such, as this
document is for general guidance only. Angel Broking Pvt. Limited or any of its affiliates/ group companies shall not be in any way
responsible for any loss or damage that may arise to any person from any inadvertent error in the information contained in this report.
Angel Broking Pvt. Limited has not independently verified all the information contained within this document. Accordingly, we cannot
testify, nor make any representation or warranty, express or implied, to the accuracy, contents or data contained within this document.
While Angel Broking Pvt. Limited endeavors to update on a reasonable basis the information discussed in this material, there may be
regulatory, compliance, or other reasons that prevent us from doing so.
This document is being supplied to you solely for your information, and its contents, information or data may not be reproduced,
redistributed or passed on, directly or indirectly.
Neither Angel Broking Pvt. Limited, nor its directors, employees or affiliates shall be liable for any loss or damage that may arise from
or in connection with the use of this information.
Disclosure of Interest Statement
GMM Pfaudler Ltd.
1. Financial interest of research analyst or Angel or his Associate or his relative
No
2. Ownership of 1% or more of the stock by research analyst or Angel or associates or relatives
No
3. Served as an officer, director or employee of the company covered under Research
No
4. Broking relationship with company covered under Research
No
Ratings (Based on expected returns
Buy (> 15%)
Accumulate (5% to 15%)
Neutral (-5 to 5%)
over 12 months investment period):
Reduce (-5% to -15%)
Sell (< -15)
April 06, 2018
14